资源下载
elasticSearch :下载最新版本的就行
kibana
filebeat:注意选择压缩包下载
更新elasticsearch.yml,默认端口9200:
# ======================== Elasticsearch Configuration =========================
#
# NOTE: Elasticsearch comes with reasonable defaults for most settings.
#       Before you set out to tweak and tune the configuration, make sure you
#       understand what are you trying to accomplish and the consequences.
#
# The primary way of configuring a node is via this file. This template lists
# the most important settings you may want to configure for a production cluster.
#
# Please consult the documentation for further information on configuration options:
# https://www.elastic.co/guide/en/elasticsearch/reference/index.html
#
# ---------------------------------- Cluster -----------------------------------
#
# Use a descriptive name for your cluster:
#
#cluster.name: my-application
#
# ------------------------------------ Node ------------------------------------
#
# Use a descriptive name for the node:
#
#node.name: node-1
#
# Add custom attributes to the node:
#
#node.attr.rack: r1
#
# ----------------------------------- Paths ------------------------------------
#
# Path to directory where to store the data (separate multiple locations by comma):
#
#path.data: /path/to/data
#
# Path to log files:
#
#path.logs: /path/to/logs
#
# ----------------------------------- Memory -----------------------------------
#
# Lock the memory on startup:
#
#bootstrap.memory_lock: true
#
# Make sure that the heap size is set to about half the memory available
# on the system and that the owner of the process is allowed to use this
# limit.
#
# Elasticsearch performs poorly when the system is swapping the memory.
#
# ---------------------------------- Network -----------------------------------
#
# By default Elasticsearch is only accessible on localhost. Set a different
# address here to expose this node on the network:
#
#network.host: 192.168.0.1
#
# By default Elasticsearch listens for HTTP traffic on the first free port it
# finds starting at 9200. Set a specific HTTP port here:
#
#http.port: 9200
#
# For more information, consult the network module documentation.
#
# --------------------------------- Discovery ----------------------------------
#
# Pass an initial list of hosts to perform discovery when this node is started:
# The default list of hosts is ["127.0.0.1", "[::1]"]
#
#discovery.seed_hosts: ["host1", "host2"]
#
# Bootstrap the cluster using an initial set of master-eligible nodes:
#
#cluster.initial_master_nodes: ["node-1", "node-2"]
#
# For more information, consult the discovery and cluster formation module documentation.
#
# ---------------------------------- Various -----------------------------------
#
# Allow wildcard deletion of indices:
#
#action.destructive_requires_name: false#----------------------- BEGIN SECURITY AUTO CONFIGURATION -----------------------
#
# The following settings, TLS certificates, and keys have been automatically
# generated to configure Elasticsearch security features on 20-02-2024 07:30:46
#
# --------------------------------------------------------------------------------# Enable security features
xpack.security.enabled: falsexpack.security.enrollment.enabled: true# Enable encryption for HTTP API client connections, such as Kibana, Logstash, and Agents
xpack.security.http.ssl:enabled: falsekeystore.path: certs/http.p12# Enable encryption and mutual authentication between cluster nodes
xpack.security.transport.ssl:enabled: trueverification_mode: certificatekeystore.path: certs/transport.p12truststore.path: certs/transport.p12
# Create a new cluster with the current node only
# Additional nodes can still join the cluster later
cluster.initial_master_nodes: ["RAYL"]# Allow HTTP API connections from anywhere
# Connections are encrypted and require user authentication
http.host: 0.0.0.0# Allow other nodes to join the cluster from anywhere
# Connections are encrypted and mutually authenticated
#transport.host: 0.0.0.0#----------------------- END SECURITY AUTO CONFIGURATION -------------------------
更新kibana.yml配置,默认端口5601:
# For more configuration options see the configuration guide for Kibana in
# https://www.elastic.co/guide/index.html# =================== System: Kibana Server ===================
# Kibana is served by a back end server. This setting specifies the port to use.
#server.port: 5601# Specifies the address to which the Kibana server will bind. IP addresses and host names are both valid values.
# The default is 'localhost', which usually means remote machines will not be able to connect.
# To allow connections from remote users, set this parameter to a non-loopback address.
#server.host: "localhost"# Enables you to specify a path to mount Kibana at if you are running behind a proxy.
# Use the `server.rewriteBasePath` setting to tell Kibana if it should remove the basePath
# from requests it receives, and to prevent a deprecation warning at startup.
# This setting cannot end in a slash.
#server.basePath: ""# Specifies whether Kibana should rewrite requests that are prefixed with
# `server.basePath` or require that they are rewritten by your reverse proxy.
# Defaults to `false`.
#server.rewriteBasePath: false# Specifies the public URL at which Kibana is available for end users. If
# `server.basePath` is configured this URL should end with the same basePath.
#server.publicBaseUrl: ""# The maximum payload size in bytes for incoming server requests.
#server.maxPayload: 1048576# The Kibana server's name. This is used for display purposes.
#server.name: "your-hostname"# =================== System: Kibana Server (Optional) ===================
# Enables SSL and paths to the PEM-format SSL certificate and SSL key files, respectively.
# These settings enable SSL for outgoing requests from the Kibana server to the browser.
#server.ssl.enabled: false
#server.ssl.certificate: /path/to/your/server.crt
#server.ssl.key: /path/to/your/server.key# =================== System: Elasticsearch ===================
# The URLs of the Elasticsearch instances to use for all your queries.
elasticsearch.hosts: ["http://localhost:9200"]# If your Elasticsearch is protected with basic authentication, these settings provide
# the username and password that the Kibana server uses to perform maintenance on the Kibana
# index at startup. Your Kibana users still need to authenticate with Elasticsearch, which
# is proxied through the Kibana server.
#elasticsearch.username: "kibana_system"
#elasticsearch.password: "pass"# Kibana can also authenticate to Elasticsearch via "service account tokens".
# Service account tokens are Bearer style tokens that replace the traditional username/password based configuration.
# Use this token instead of a username/password.
# elasticsearch.serviceAccountToken: "my_token"# Time in milliseconds to wait for Elasticsearch to respond to pings. Defaults to the value of
# the elasticsearch.requestTimeout setting.
#elasticsearch.pingTimeout: 1500# Time in milliseconds to wait for responses from the back end or Elasticsearch. This value
# must be a positive integer.
#elasticsearch.requestTimeout: 30000# The maximum number of sockets that can be used for communications with elasticsearch.
# Defaults to `Infinity`.
#elasticsearch.maxSockets: 1024# Specifies whether Kibana should use compression for communications with elasticsearch
# Defaults to `false`.
#elasticsearch.compression: false# List of Kibana client-side headers to send to Elasticsearch. To send *no* client-side
# headers, set this value to [] (an empty list).
#elasticsearch.requestHeadersWhitelist: [ authorization ]# Header names and values that are sent to Elasticsearch. Any custom headers cannot be overwritten
# by client-side headers, regardless of the elasticsearch.requestHeadersWhitelist configuration.
#elasticsearch.customHeaders: {}# Time in milliseconds for Elasticsearch to wait for responses from shards. Set to 0 to disable.
#elasticsearch.shardTimeout: 30000# =================== System: Elasticsearch (Optional) ===================
# These files are used to verify the identity of Kibana to Elasticsearch and are required when
# xpack.security.http.ssl.client_authentication in Elasticsearch is set to required.
#elasticsearch.ssl.certificate: /path/to/your/client.crt
#elasticsearch.ssl.key: /path/to/your/client.key# Enables you to specify a path to the PEM file for the certificate
# authority for your Elasticsearch instance.
#elasticsearch.ssl.certificateAuthorities: [ "/path/to/your/CA.pem" ]# To disregard the validity of SSL certificates, change this setting's value to 'none'.
#elasticsearch.ssl.verificationMode: full# =================== System: Logging ===================
# Set the value of this setting to off to suppress all logging output, or to debug to log everything. Defaults to 'info'
#logging.root.level: debug# Enables you to specify a file where Kibana stores log output.
#logging.appenders.default:
#  type: file
#  fileName: /var/logs/kibana.log
#  layout:
#    type: json# Logs queries sent to Elasticsearch.
#logging.loggers:
#  - name: elasticsearch.query
#    level: debug# Logs http responses.
#logging.loggers:
#  - name: http.server.response
#    level: debug# Logs system usage information.
#logging.loggers:
#  - name: metrics.ops
#    level: debug# =================== System: Other ===================
# The path where Kibana stores persistent data not saved in Elasticsearch. Defaults to data
#path.data: data# Specifies the path where Kibana creates the process ID file.
#pid.file: /run/kibana/kibana.pid# Set the interval in milliseconds to sample system and process performance
# metrics. Minimum is 100ms. Defaults to 5000ms.
#ops.interval: 5000# Specifies locale to be used for all localizable strings, dates and number formats.
# Supported languages are the following: English (default) "en", Chinese "zh-CN", Japanese "ja-JP", French "fr-FR".
i18n.locale: "zh-CN"# =================== Frequently used (Optional)===================# =================== Saved Objects: Migrations ===================
# Saved object migrations run at startup. If you run into migration-related issues, you might need to adjust these settings.# The number of documents migrated at a time.
# If Kibana can't start up or upgrade due to an Elasticsearch `circuit_breaking_exception`,
# use a smaller batchSize value to reduce the memory pressure. Defaults to 1000 objects per batch.
#migrations.batchSize: 1000# The maximum payload size for indexing batches of upgraded saved objects.
# To avoid migrations failing due to a 413 Request Entity Too Large response from Elasticsearch.
# This value should be lower than or equal to your Elasticsearch cluster’s `http.max_content_length`
# configuration option. Default: 100mb
#migrations.maxBatchSizeBytes: 100mb# The number of times to retry temporary migration failures. Increase the setting
# if migrations fail frequently with a message such as `Unable to complete the [...] step after
# 15 attempts, terminating`. Defaults to 15
#migrations.retryAttempts: 15# =================== Search Autocomplete ===================
# Time in milliseconds to wait for autocomplete suggestions from Elasticsearch.
# This value must be a whole number greater than zero. Defaults to 1000ms
#unifiedSearch.autocomplete.valueSuggestions.timeout: 1000# Maximum number of documents loaded by each shard to generate autocomplete suggestions.
# This value must be a whole number greater than zero. Defaults to 100_000
#unifiedSearch.autocomplete.valueSuggestions.terminateAfter: 100000
更新filebeat.yml: 命令行执行 install-service-filebeat.ps1 把filebeat安装为windows服务,在service中搜索
注意如果显示执行脚本未签名,更新windows ExecutionPolicy为RemoteSigned,执行指令Set-ExecutionPolicy RemoteSigned
###################### Filebeat Configuration Example ########################## This file is an example configuration file highlighting only the most common
# options. The filebeat.reference.yml file from the same directory contains all the
# supported options with more comments. You can use it as a reference.
#
# You can find the full configuration reference here:
# https://www.elastic.co/guide/en/beats/filebeat/index.html# For more available modules and options, please see the filebeat.reference.yml sample
# configuration file.# ============================== Filebeat inputs ===============================filebeat.inputs:# Each - is an input. Most options can be set at the input level, so
# you can use different inputs for various configurations.
# Below are the input-specific configurations.# filestream is an input for collecting log messages from files.
- type: log# Unique ID among all inputs, an ID is required.id: my-filestream-id# Change to true to enable this input configuration.enabled: true# Paths that should be crawled and fetched. Glob based paths.paths:#- /var/log/*.log- your log path(这里改成你的日志地址 * 是通配符匹配文件夹下所有文件例如:E:\Project\log\* )# Exclude lines. A list of regular expressions to match. It drops the lines that are# matching any regular expression from the list.# Line filtering happens after the parsers pipeline. If you would like to filter lines# before parsers, use include_message parser.#exclude_lines: ['^DBG']# Include lines. A list of regular expressions to match. It exports the lines that are# matching any regular expression from the list.# Line filtering happens after the parsers pipeline. If you would like to filter lines# before parsers, use include_message parser.#include_lines: ['^ERR', '^WARN']# Exclude files. A list of regular expressions to match. Filebeat drops the files that# are matching any regular expression from the list. By default, no files are dropped.#prospector.scanner.exclude_files: ['.gz$']# Optional additional fields. These fields can be freely picked# to add additional information to the crawled log files for filtering#fields:# level: debug# review: 1# ============================== Filebeat modules ==============================filebeat.config.modules:# Glob pattern for configuration loadingpath: ${path.config}/modules.d/*.yml# Set to true to enable config reloadingreload.enabled: false# Period on which files under path should be checked for changes#reload.period: 10s# ======================= Elasticsearch template setting =======================setup.template.settings:index.number_of_shards: 1#index.codec: best_compression#_source.enabled: false# ================================== General ===================================# The name of the shipper that publishes the network data. It can be used to group
# all the transactions sent by a single shipper in the web interface.
#name:# The tags of the shipper are included in their field with each
# transaction published.
#tags: ["service-X", "web-tier"]# Optional fields that you can specify to add additional information to the
# output.
#fields:
# env: staging# ================================= Dashboards =================================
# These settings control loading the sample dashboards to the Kibana index. Loading
# the dashboards is disabled by default and can be enabled either by setting the
# options here or by using the `setup` command.
#setup.dashboards.enabled: false# The URL from where to download the dashboard archive. By default, this URL
# has a value that is computed based on the Beat name and version. For released
# versions, this URL points to the dashboard archive on the artifacts.elastic.co
# website.
#setup.dashboards.url:# =================================== Kibana ===================================# Starting with Beats version 6.0.0, the dashboards are loaded via the Kibana API.
# This requires a Kibana endpoint configuration.
setup.kibana:# Kibana Host# Scheme and port can be left out and will be set to the default (http and 5601)# In case you specify and additional path, the scheme is required: http://localhost:5601/path# IPv6 addresses should always be defined as: https://[2001:db8::1]:5601host: "localhost:5601"# Kibana Space ID# ID of the Kibana Space into which the dashboards should be loaded. By default,# the Default Space will be used.#space.id:# =============================== Elastic Cloud ================================# These settings simplify using Filebeat with the Elastic Cloud (https://cloud.elastic.co/).# The cloud.id setting overwrites the `output.elasticsearch.hosts` and
# `setup.kibana.host` options.
# You can find the `cloud.id` in the Elastic Cloud web UI.
#cloud.id:# The cloud.auth setting overwrites the `output.elasticsearch.username` and
# `output.elasticsearch.password` settings. The format is `<user>:<pass>`.
#cloud.auth:# ================================== Outputs ===================================# Configure what output to use when sending the data collected by the beat.# ---------------------------- Elasticsearch Output ----------------------------
output.elasticsearch:# Array of hosts to connect to.hosts: ["localhost:9200"]# Performance preset - one of "balanced", "throughput", "scale",# "latency", or "custom".preset: balanced# Protocol - either `http` (default) or `https`.#protocol: "https"# Authentication credentials - either API key or username/password.#api_key: "id:api_key"#username: "elastic"#password: "changeme"# ------------------------------ Logstash Output -------------------------------
#output.logstash:# The Logstash hosts#hosts: ["localhost:5044"]# Optional SSL. By default is off.# List of root certificates for HTTPS server verifications#ssl.certificate_authorities: ["/etc/pki/root/ca.pem"]# Certificate for SSL client authentication#ssl.certificate: "/etc/pki/client/cert.pem"# Client Certificate Key#ssl.key: "/etc/pki/client/cert.key"# ================================= Processors =================================
processors:- add_host_metadata:when.not.contains.tags: forwarded- add_cloud_metadata: ~- add_docker_metadata: ~- add_kubernetes_metadata: ~# ================================== Logging ===================================# Sets log level. The default log level is info.
# Available log levels are: error, warning, info, debug
#logging.level: debug# At debug level, you can selectively enable logging only for some components.
# To enable all selectors, use ["*"]. Examples of other selectors are "beat",
# "publisher", "service".
#logging.selectors: ["*"]# ============================= X-Pack Monitoring ==============================
# Filebeat can export internal metrics to a central Elasticsearch monitoring
# cluster. This requires xpack monitoring to be enabled in Elasticsearch. The
# reporting is disabled by default.# Set to true to enable the monitoring reporter.
#monitoring.enabled: false# Sets the UUID of the Elasticsearch cluster under which monitoring data for this
# Filebeat instance will appear in the Stack Monitoring UI. If output.elasticsearch
# is enabled, the UUID is derived from the Elasticsearch cluster referenced by output.elasticsearch.
#monitoring.cluster_uuid:# Uncomment to send the metrics to Elasticsearch. Most settings from the
# Elasticsearch outputs are accepted here as well.
# Note that the settings should point to your Elasticsearch *monitoring* cluster.
# Any setting that is not set is automatically inherited from the Elasticsearch
# output configuration, so if you have the Elasticsearch output configured such
# that it is pointing to your Elasticsearch monitoring cluster, you can simply
# uncomment the following line.
#monitoring.elasticsearch:# ============================== Instrumentation ===============================# Instrumentation support for the filebeat.
#instrumentation:# Set to true to enable instrumentation of filebeat.#enabled: false# Environment in which filebeat is running on (eg: staging, production, etc.)#environment: ""# APM Server hosts to report instrumentation results to.#hosts:# - http://localhost:8200# API Key for the APM Server(s).# If api_key is set then secret_token will be ignored.#api_key:# Secret token for the APM Server(s).#secret_token:# ================================= Migration ==================================# This allows to enable 6.7 migration aliases
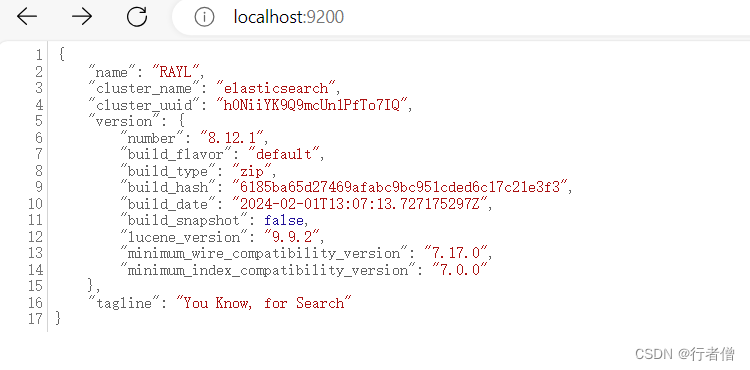
#migration.6_to_7.enabled: trueelastic执行:命令行到解压后的bin文件夹 ./elasticsearch
启动后浏览器打开 http://localhost:9200
kibana: 命令行到解压后的bin文件夹 ./kibana.bat
浏览器打开 http://localhost:5601
filebeat: 直接从service启动
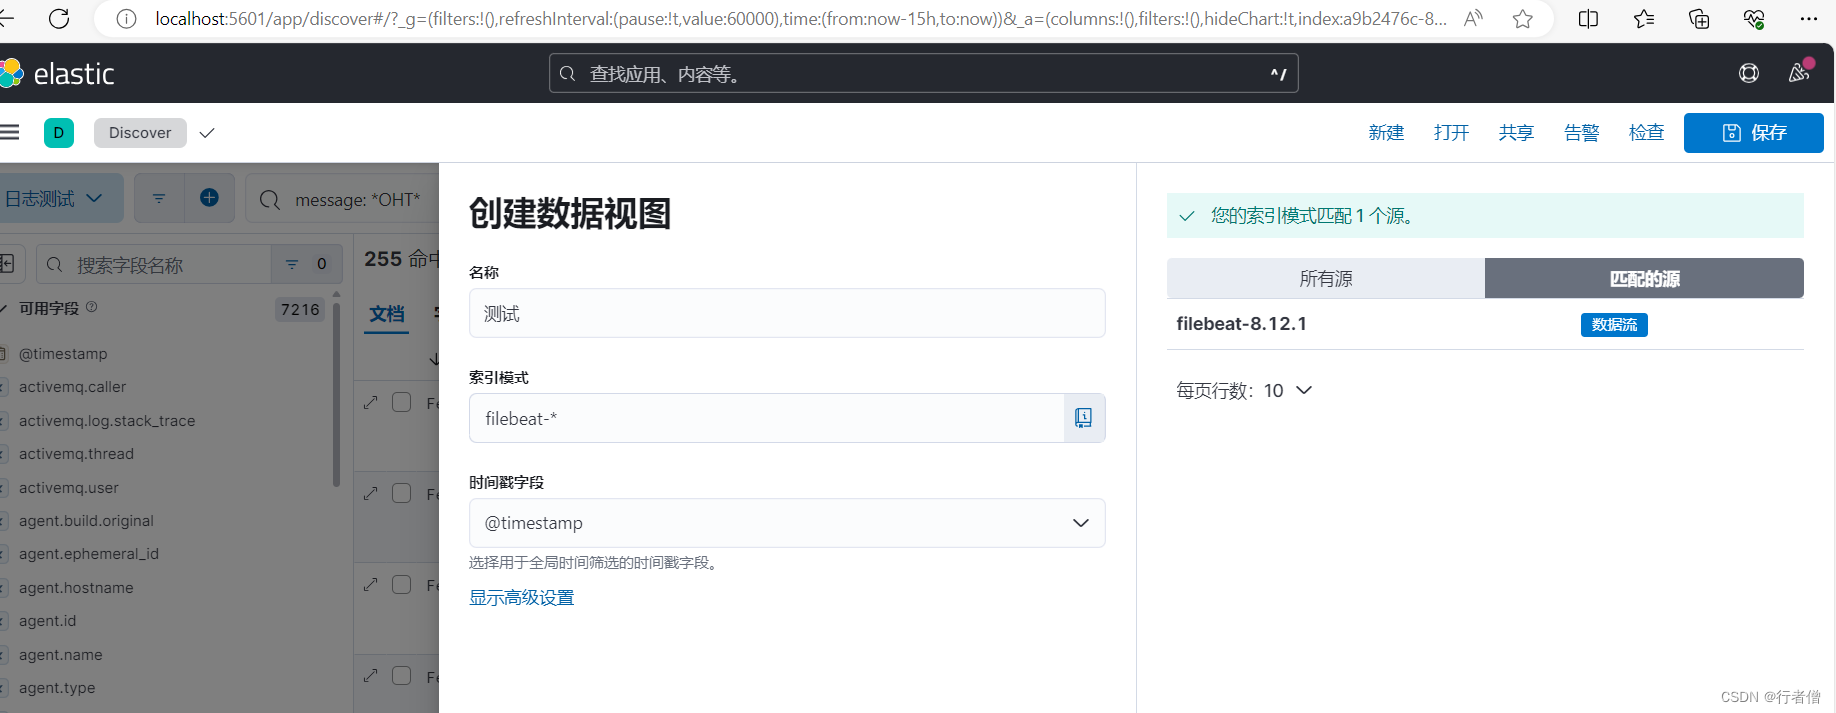
kibana创建数据视图,右边可以看到filebeat的源,索引模式匹配右边的数据源名称,这个名称可以在filebeat.yml配置:
对了,别忘了先安装java8及以上版本,ElasticSearch需要java环境